One chart at a time on the money and policy behind space, defense, energy and manufacturing.
Each issue in your inbox the morning it publishes, a note the day a forecast is graded, and occasional Reckoning news. Free, in English and Spanish. No list sharing, unsubscribe in one click. Privacy.
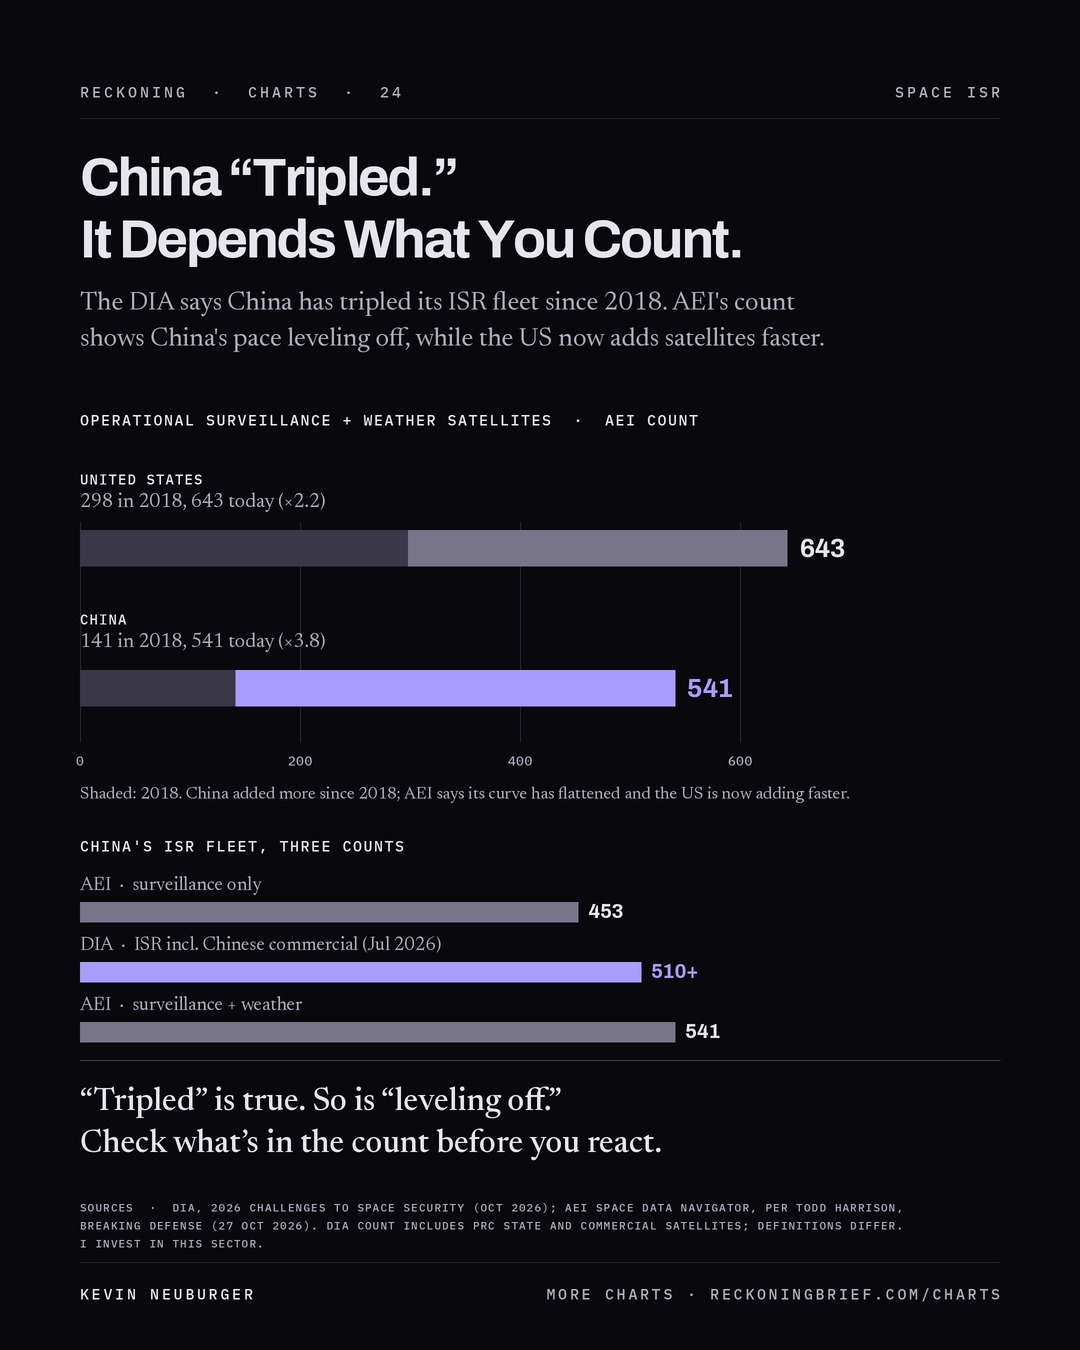
24 · China “Tripled.” It Depends What You Count
The DIA says China has tripled its ISR fleet since 2018. AEI's count shows China's pace leveling off, while the US now adds satellites faster.
27 Oct 2026
SourcesDIA, 2026 Challenges to Space Security (Oct 2026); AEI Space Data Navigator, per Todd Harrison, Breaking Defense (27 Oct 2026). The DIA count includes PRC state and commercial satellites; definitions differ.
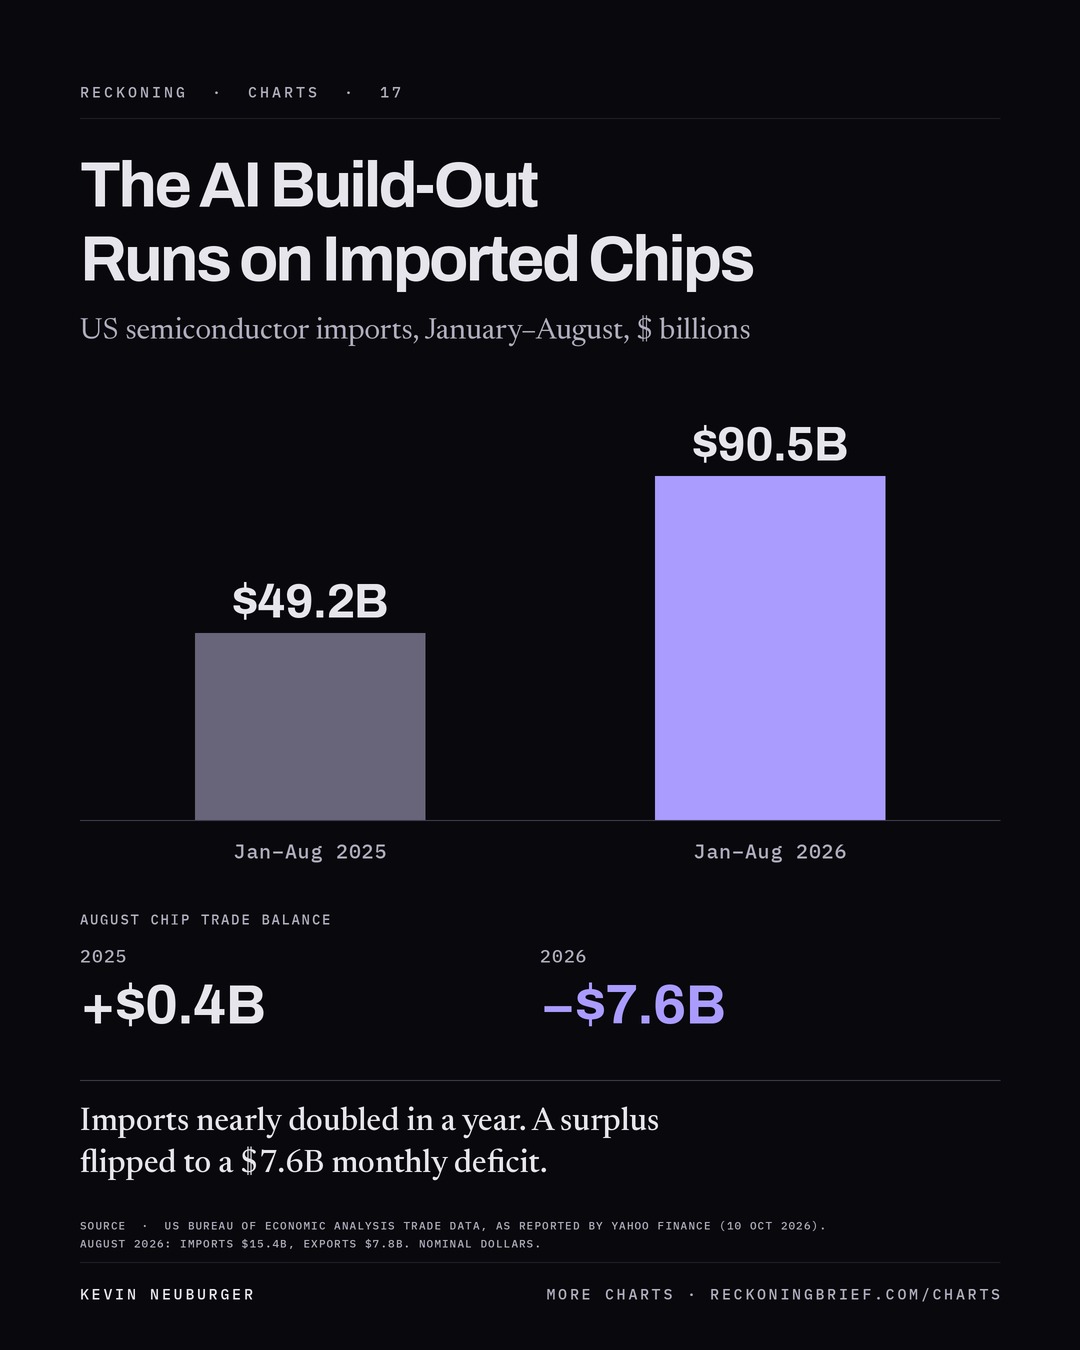
17 · The AI Build-Out Runs on Imported Chips
US chip imports nearly doubled in a year, and a small August surplus became a $7.6B deficit.
10 Oct 2026
SourcesUS Bureau of Economic Analysis trade data, as reported by Yahoo Finance (10 Oct 2026). August 2026: imports $15.4B, exports $7.8B. Nominal dollars.
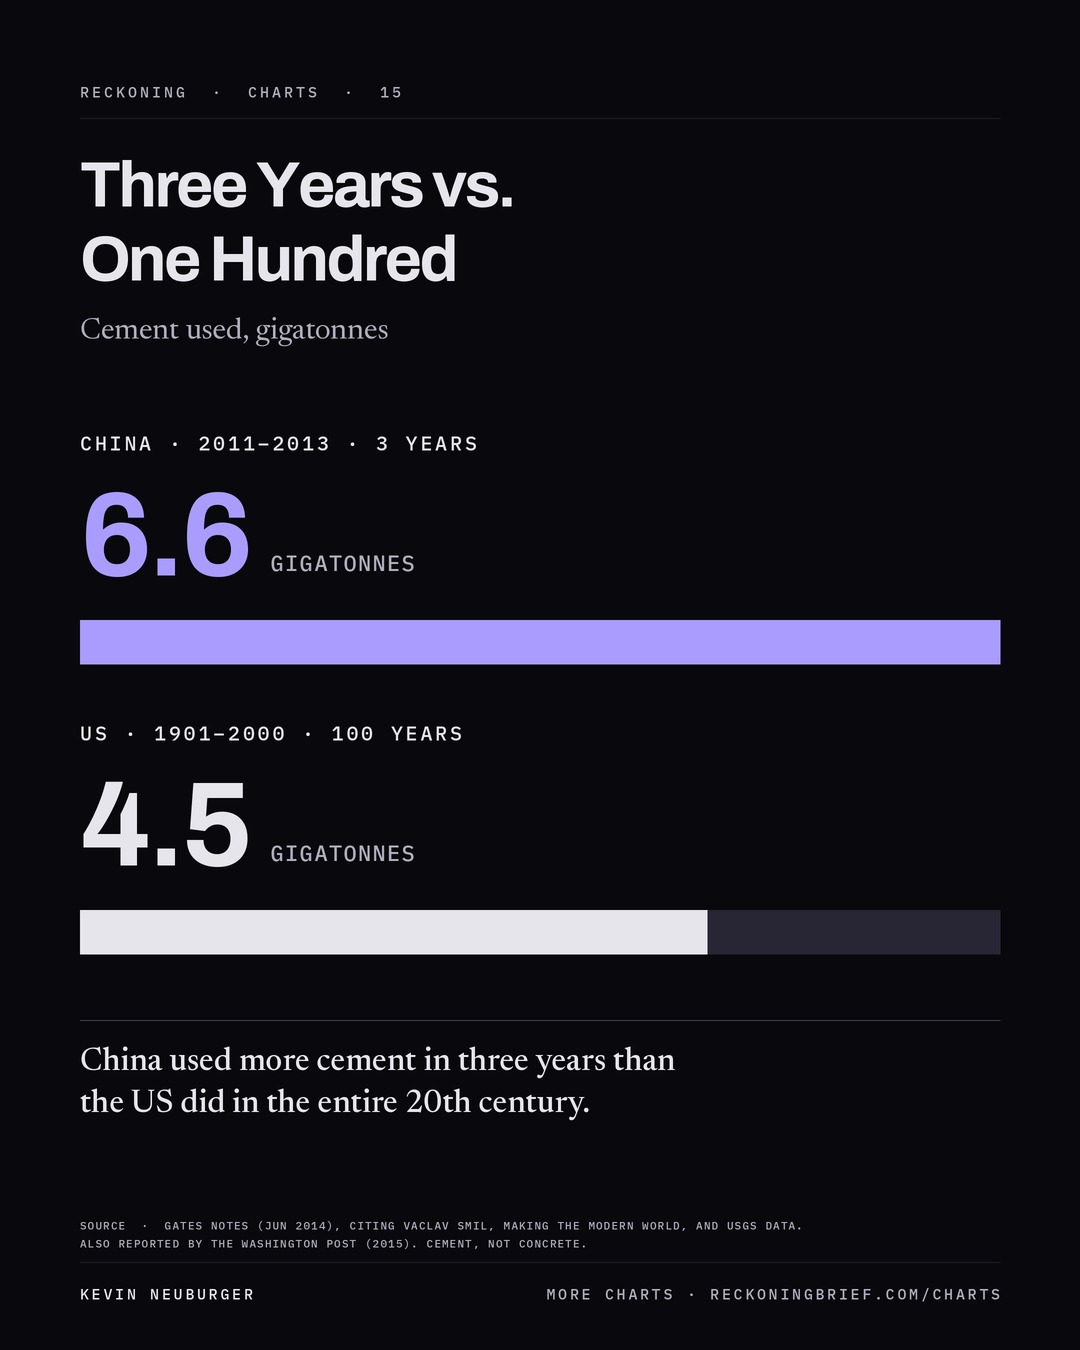
15 · Three Years vs. One Hundred
China used more cement in three years than the US did in the entire 20th century.
10 Oct 2026
SourcesGates Notes (Jun 2014), citing Vaclav Smil, Making the Modern World, and USGS data.
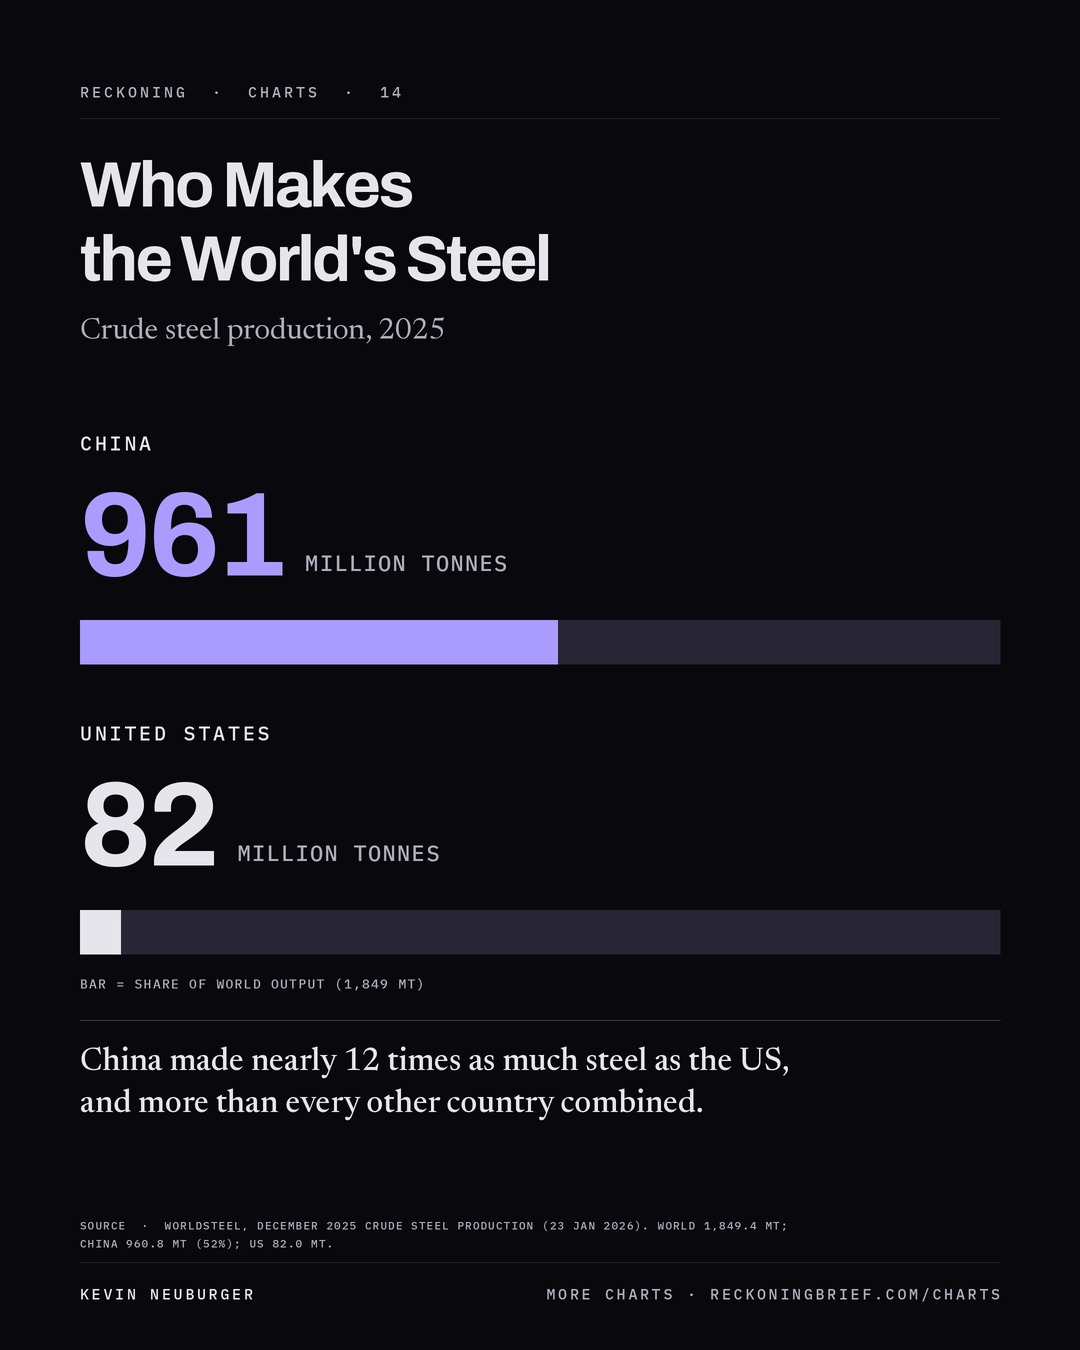
14 · Who Makes the World's Steel
China made nearly 12 times as much steel as the US in 2025, and more than every other country combined.
10 Oct 2026
Sourcesworldsteel, December 2025 crude steel production (23 Jan 2026). World 1,849.4 Mt; China 960.8 Mt (52%); US 82.0 Mt.
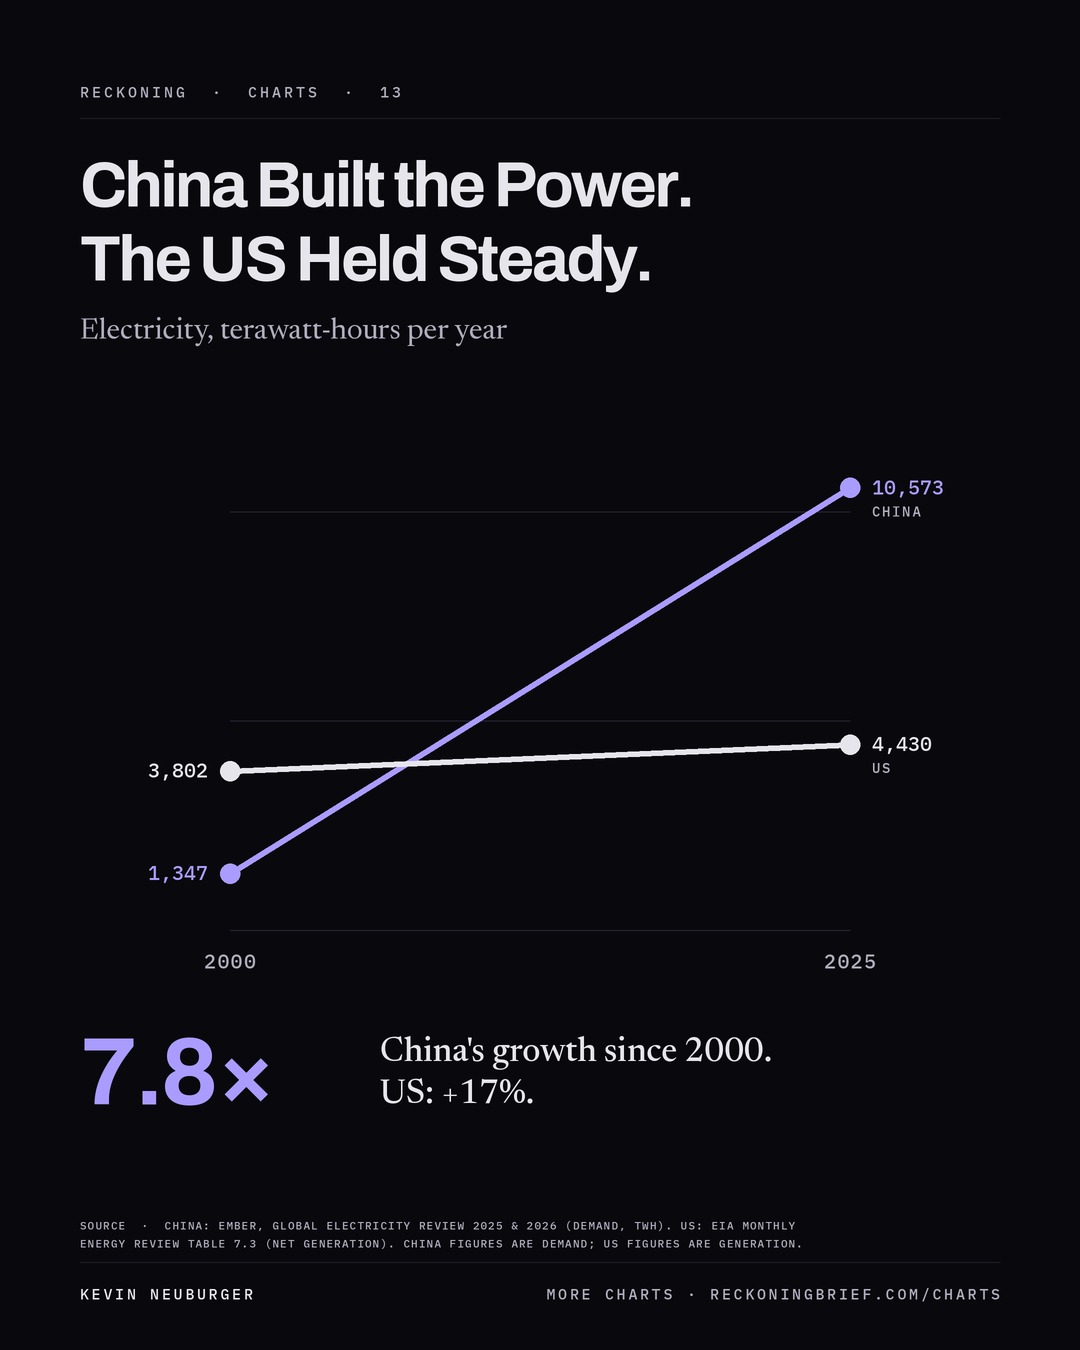
13 · China Built the Power. The US Held Steady.
China's electricity use grew 7.8 times from 2000 to 2025; US generation grew 17%.
10 Oct 2026
SourcesChina: Ember, Global Electricity Review 2025 and 2026 (demand, TWh). US: EIA Monthly Energy Review Table 7.3 (net generation). China figures are demand; US figures are generation.
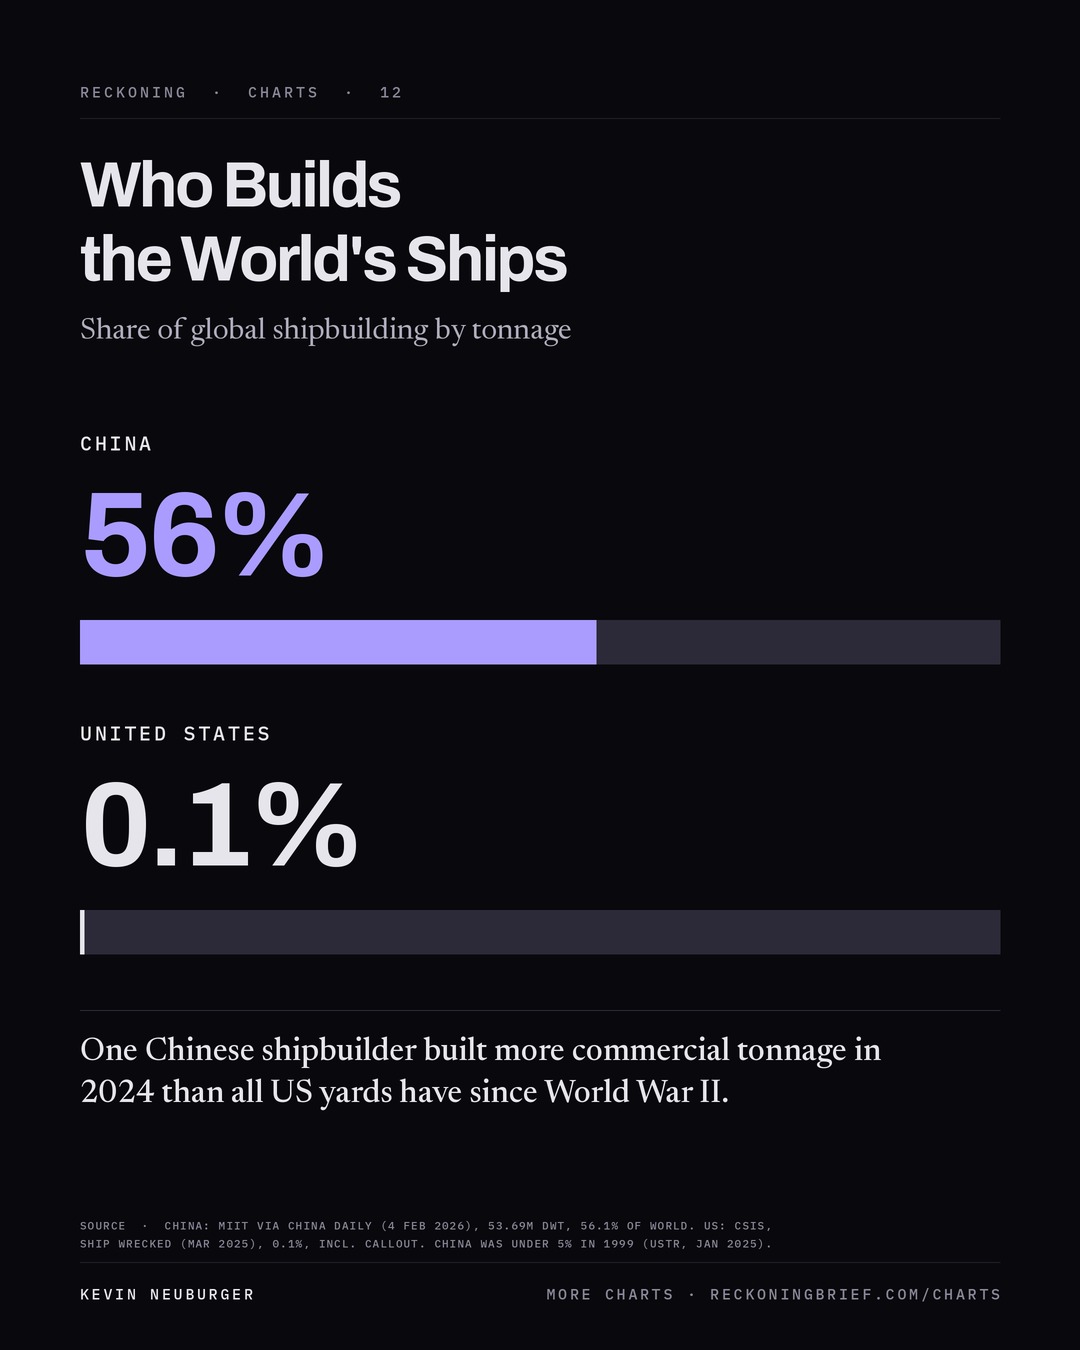
12 · Who Builds the World's Ships
China builds 56% of the world's ships by tonnage; the US builds 0.1%.
10 Oct 2026
SourcesChina: MIIT via China Daily (4 Feb 2026), 53.69M DWT, 56.1% of world. US: CSIS, Ship Wrecked (Mar 2025), 0.1%, including the callout. China was under 5% in 1999 (USTR, Jan 2025).
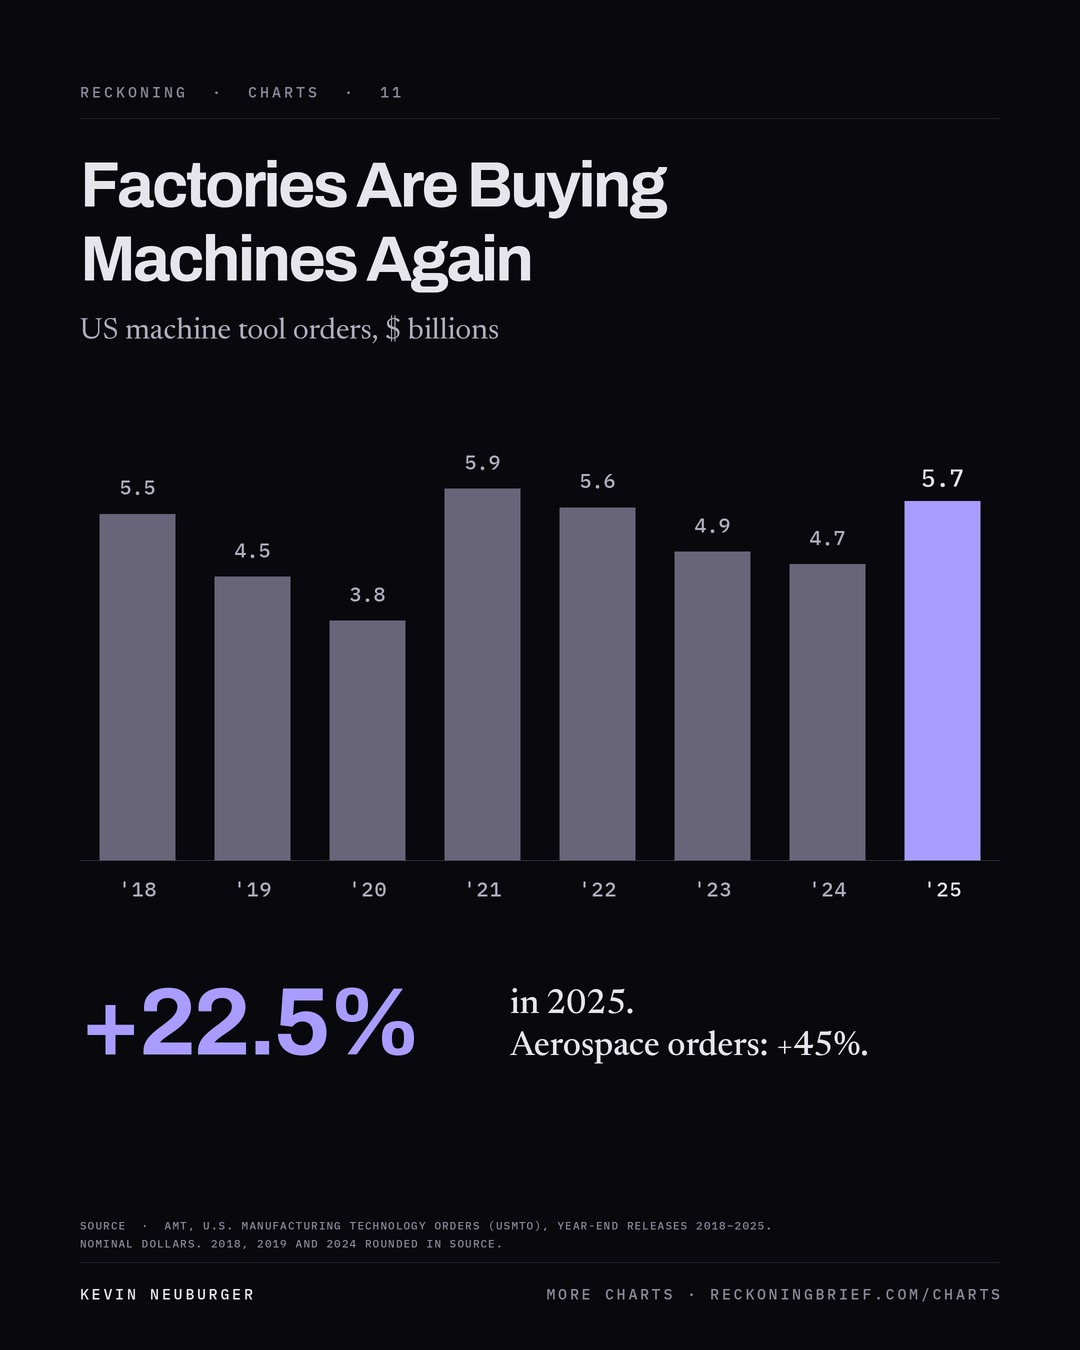
11 · Factories Are Buying Machines Again
US machine tool orders rose 22.5% in 2025, and aerospace orders rose 45%.
10 Oct 2026
SourcesAMT, U.S. Manufacturing Technology Orders (USMTO), year-end releases 2018–2025. Nominal dollars. 2018, 2019 and 2024 rounded in source.
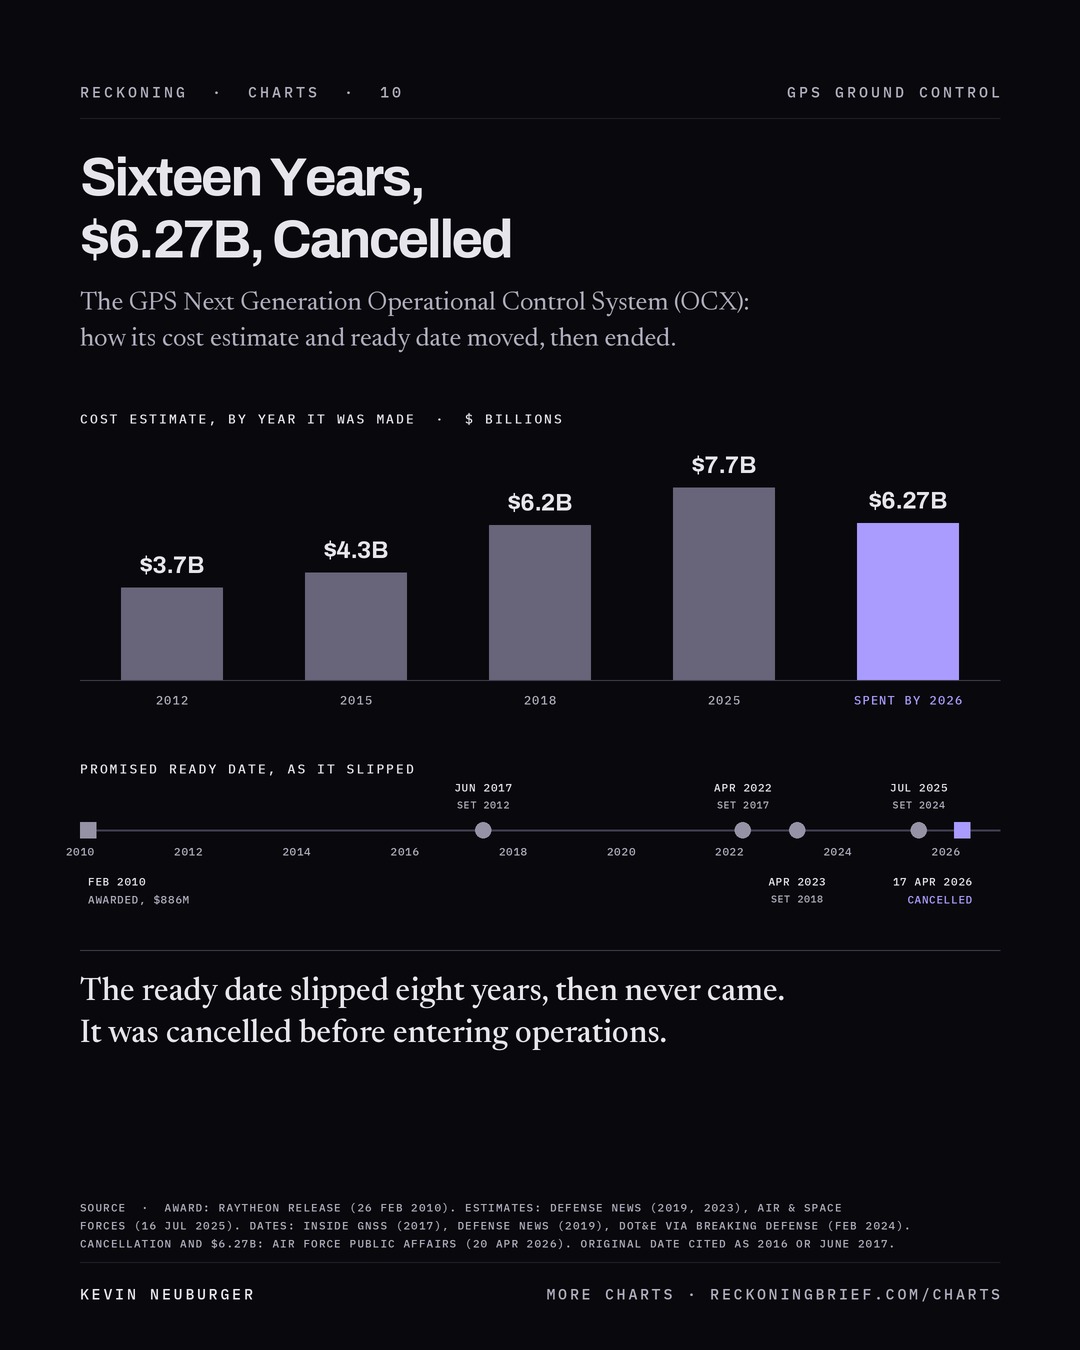
10 · Sixteen Years, $6.27B, Cancelled
The GPS ground control system's ready date slipped eight years, and it was cancelled in April 2026 before entering operations.
9 Oct 2026
SourcesAward: Raytheon release (26 Feb 2010). Estimates: Defense News (2019, 2023), Air & Space Forces (16 Jul 2025). Dates: Inside GNSS (2017), Defense News (2019), DOT&E via Breaking Defense (Feb 2024). Cancellation and $6.27B: Air Force Public Affairs (20 Apr 2026). Original date cited as 2016 or June 2017.
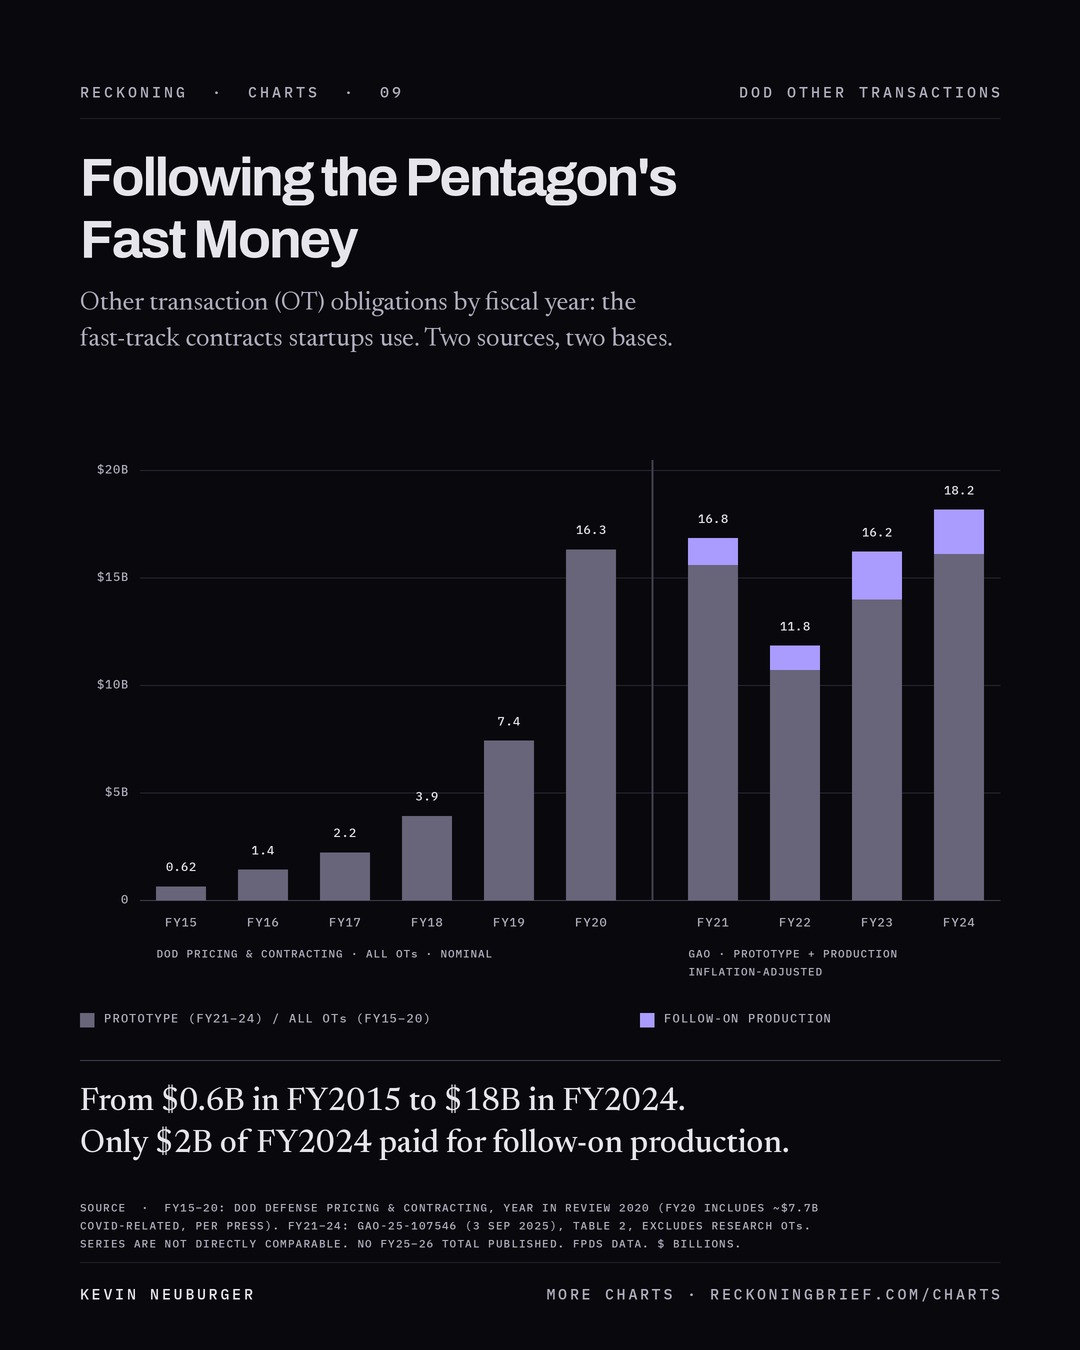
09 · Following the Pentagon's Fast Money
DoD other transaction obligations rose from $0.6B in FY2015 to $18B in FY2024; only $2B of FY2024 paid for follow-on production.
9 Oct 2026
SourcesFY15–20: DoD Defense Pricing & Contracting, Year in Review 2020 (FY20 includes ~$7.7B COVID-related, per press). FY21–24: GAO-25-107546 (3 Sep 2025), Table 2, excludes research OTs. Series are not directly comparable. No FY25–26 total published.
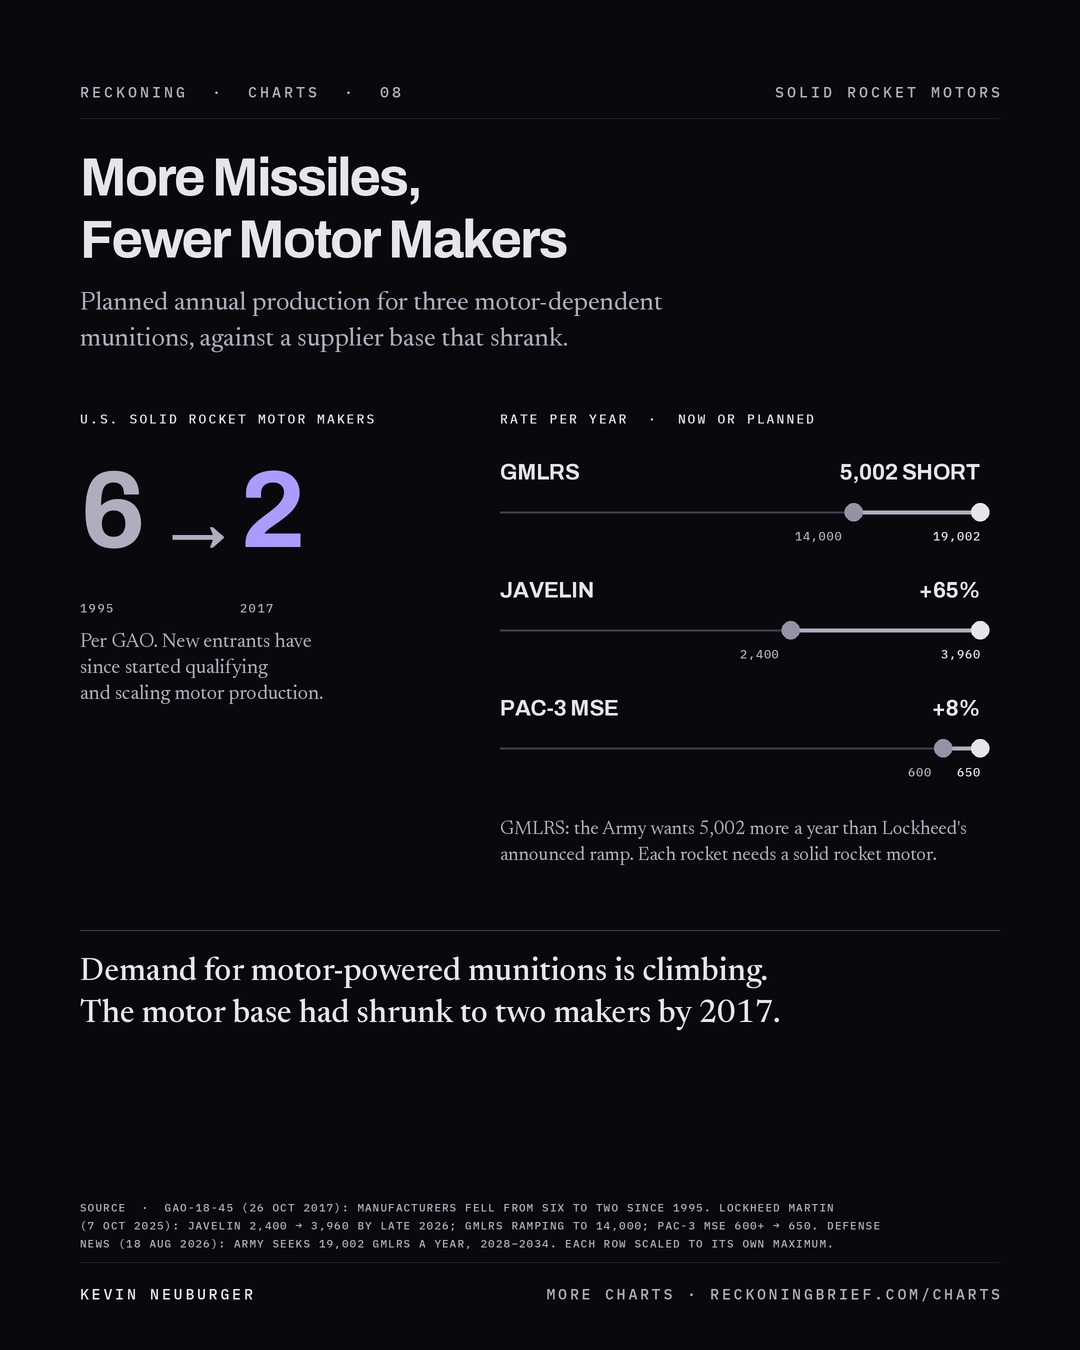
08 · More Missiles, Fewer Motor Makers
Planned output of three motor-dependent munitions is climbing, against a solid rocket motor base that had shrunk from six makers to two by 2017.
9 Oct 2026
SourcesGAO-18-45 (26 Oct 2017): manufacturers fell from six to two since 1995. Lockheed Martin (7 Oct 2025): Javelin 2,400 to 3,960 by late 2026; GMLRS ramping to 14,000; PAC-3 MSE 600+ to 650. Defense News (18 Aug 2026): Army seeks 19,002 GMLRS a year, 2028–2034.
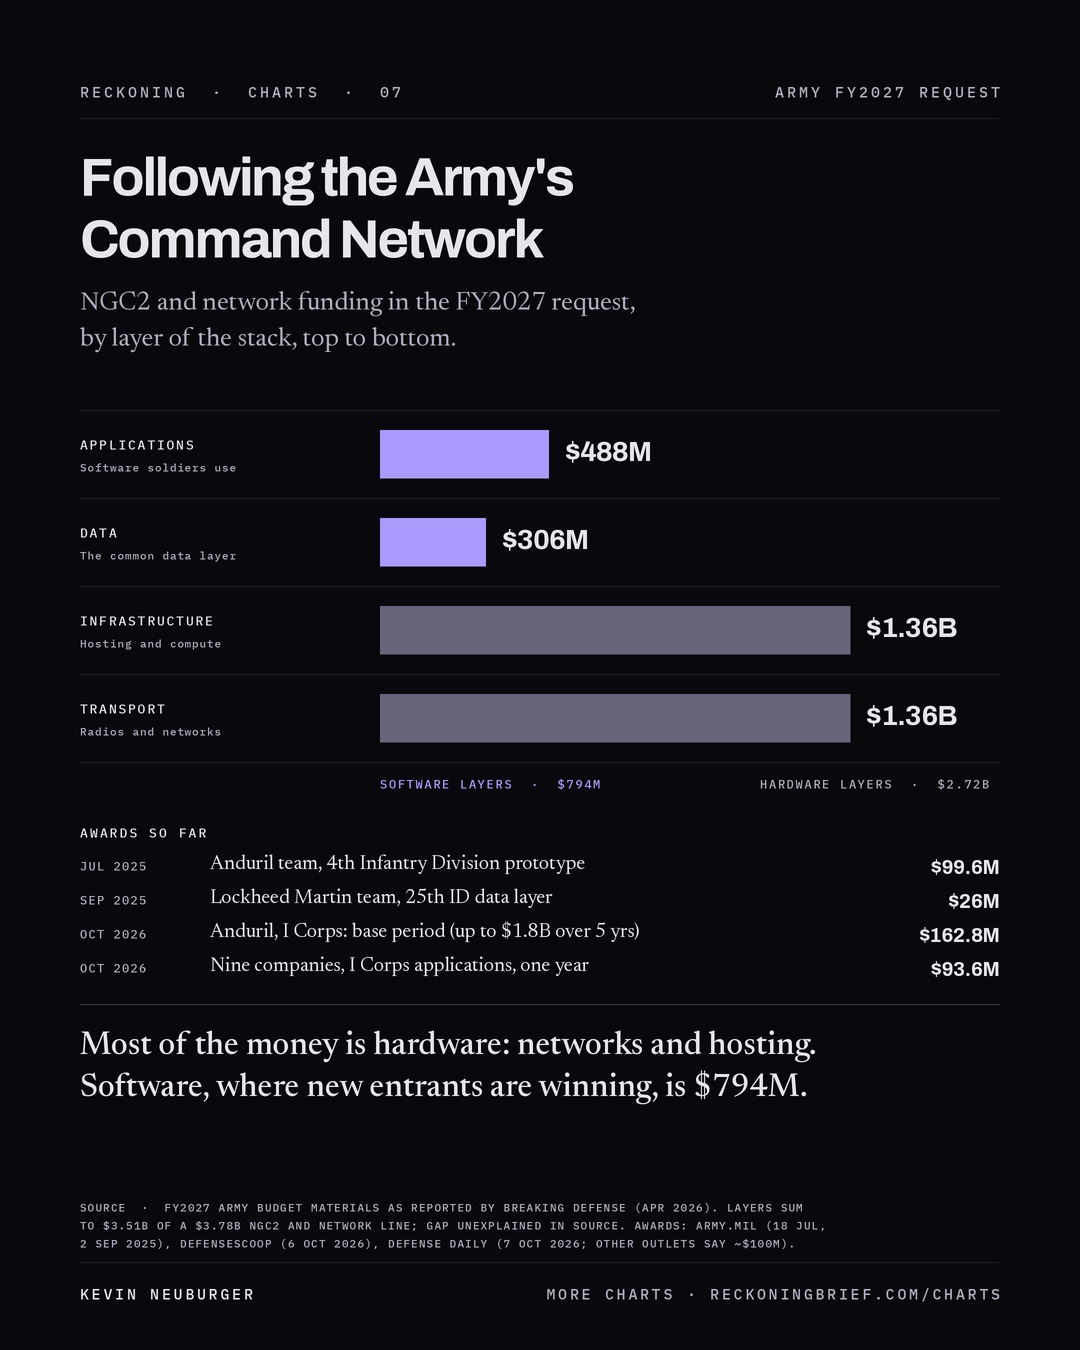
07 · Following the Army's Command Network
Most of the Army's FY2027 command-network money is hardware; software, where new entrants are winning, is $794M of it.
9 Oct 2026
SourcesFY2027 Army budget materials as reported by Breaking Defense (Apr 2026). Layers sum to $3.51B of a $3.78B NGC2 and network line; gap unexplained in source. Awards: army.mil (18 Jul, 2 Sep 2025), DefenseScoop (6 Oct 2026), Defense Daily (7 Oct 2026; other outlets say ~$100M).

06 · Each Stage Gets the Capital It Needs
Venture equity pays for the first stage and the last; cheaper money should carry everything in between.
9 Oct 2026
SourcesIllustrative framework, not data. Examples: Furientis founder's note (6 Oct 2026), X-Bow via Seapower (7 Oct 2026), Anduril release (6 Oct 2026), SendCutSend release (19 May 2026), Jim Belosic at SF Tech Week (7 Oct 2026).
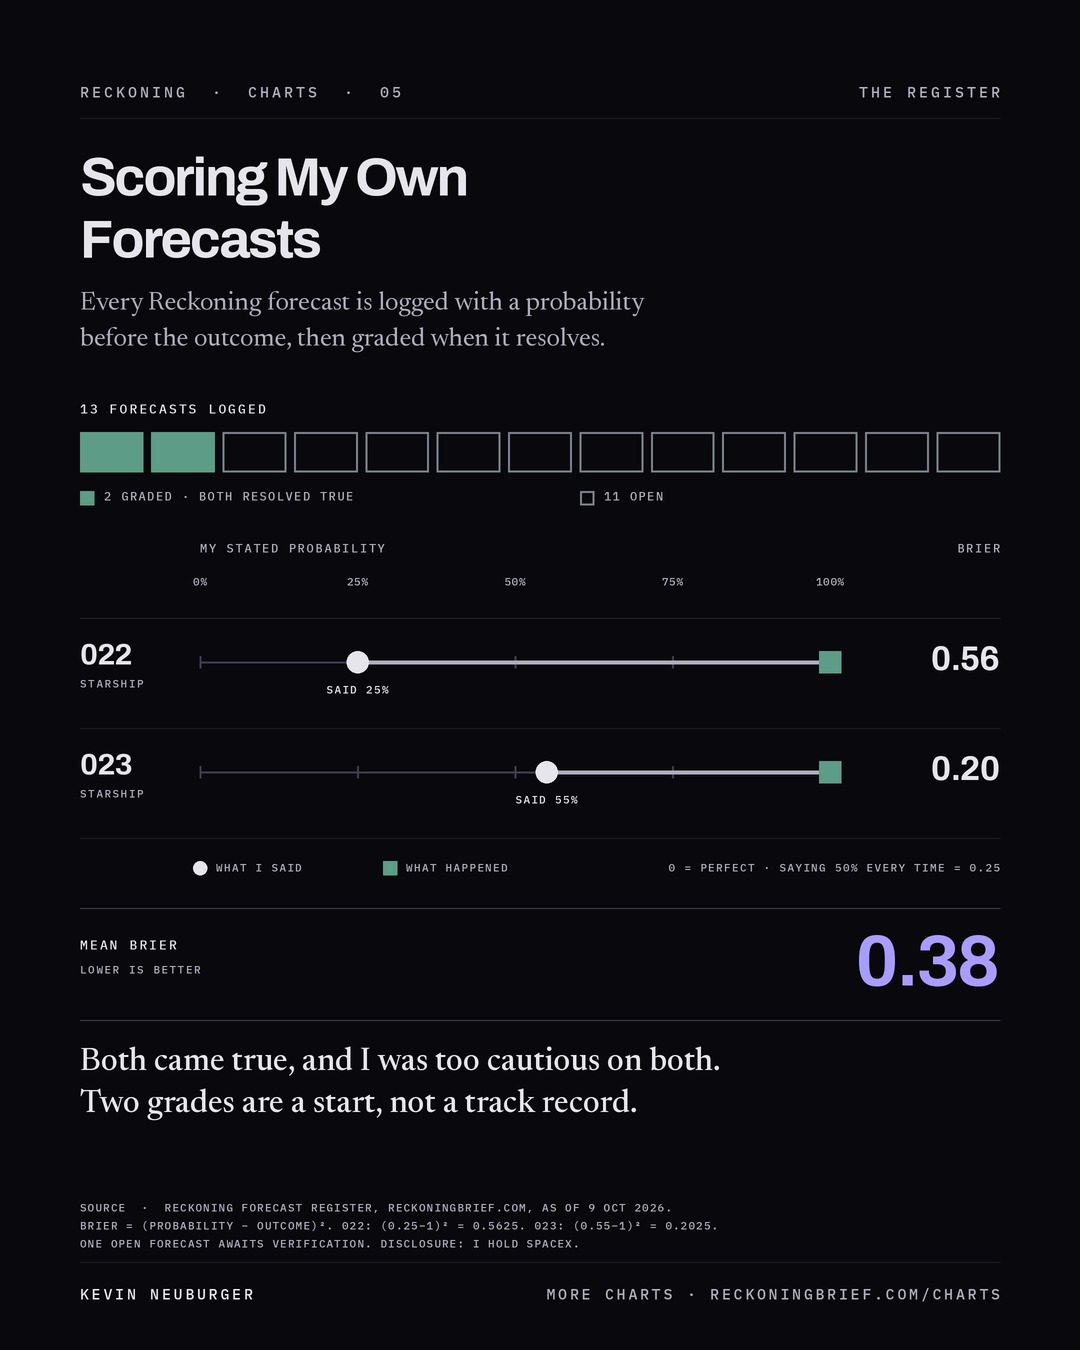
05 · Scoring My Own Forecasts
13 forecasts logged; 2 graded, both resolved true; mean Brier score 0.38.
9 Oct 2026
SourcesReckoning forecast register. Disclosure: I hold SpaceX.
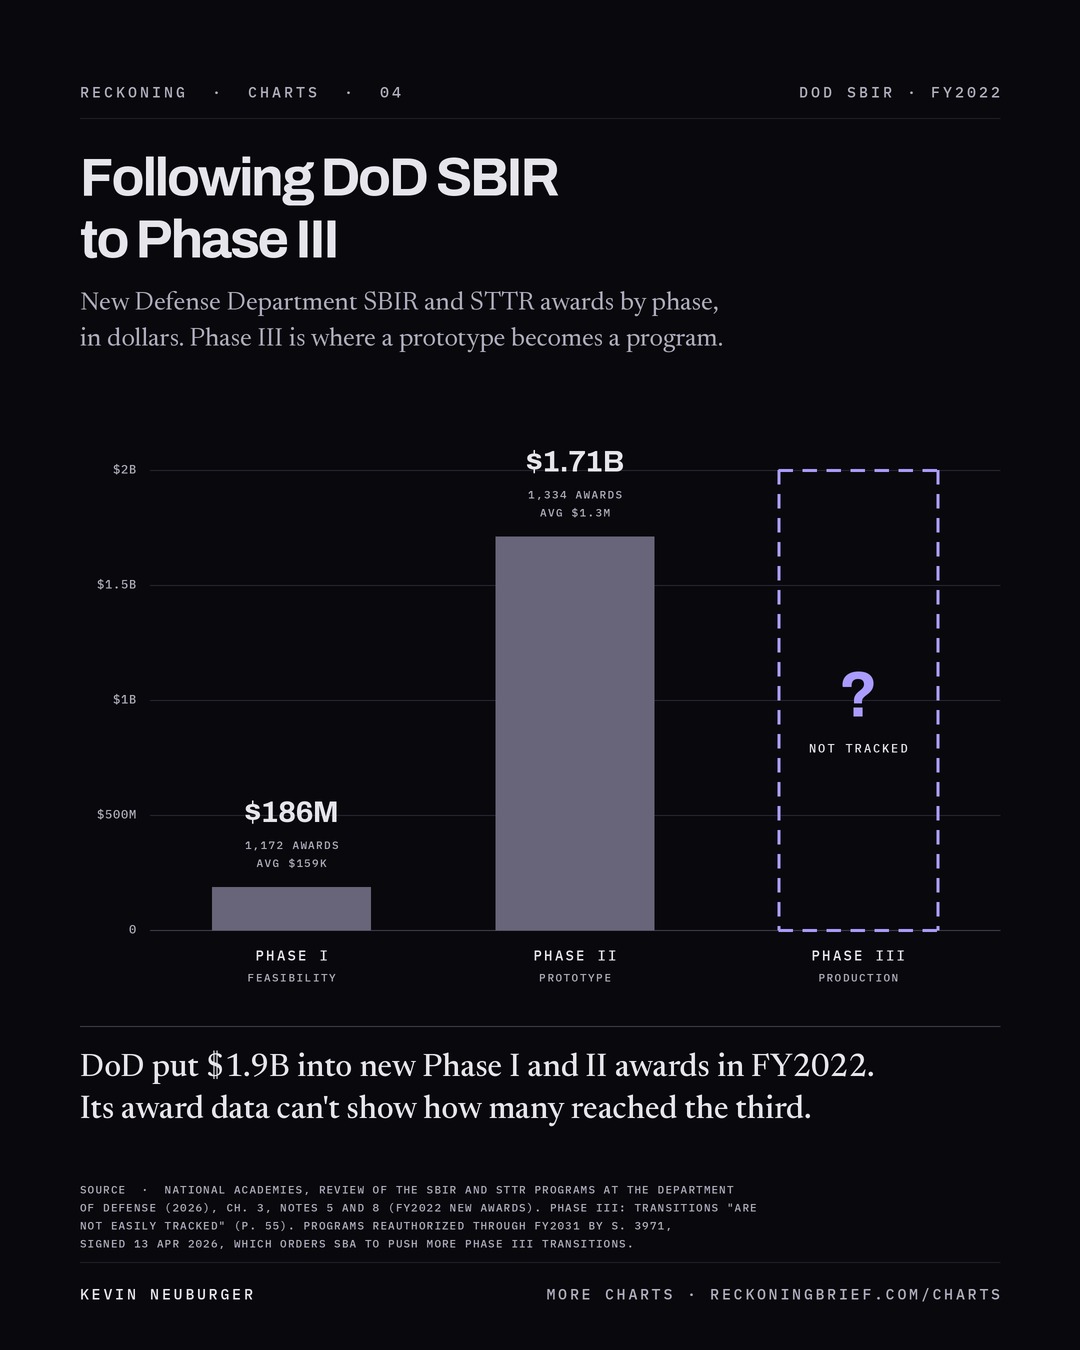
04 · Following DoD SBIR to Phase III
DoD put $1.9B into new Phase I and II awards in FY2022; its award data can't show how many reached Phase III.
9 Oct 2026
SourcesNational Academies, Review of the SBIR and STTR Programs at the Department of Defense (2026), ch. 3. Link: https://www.nationalacademies.org/read/29329/chapter/5
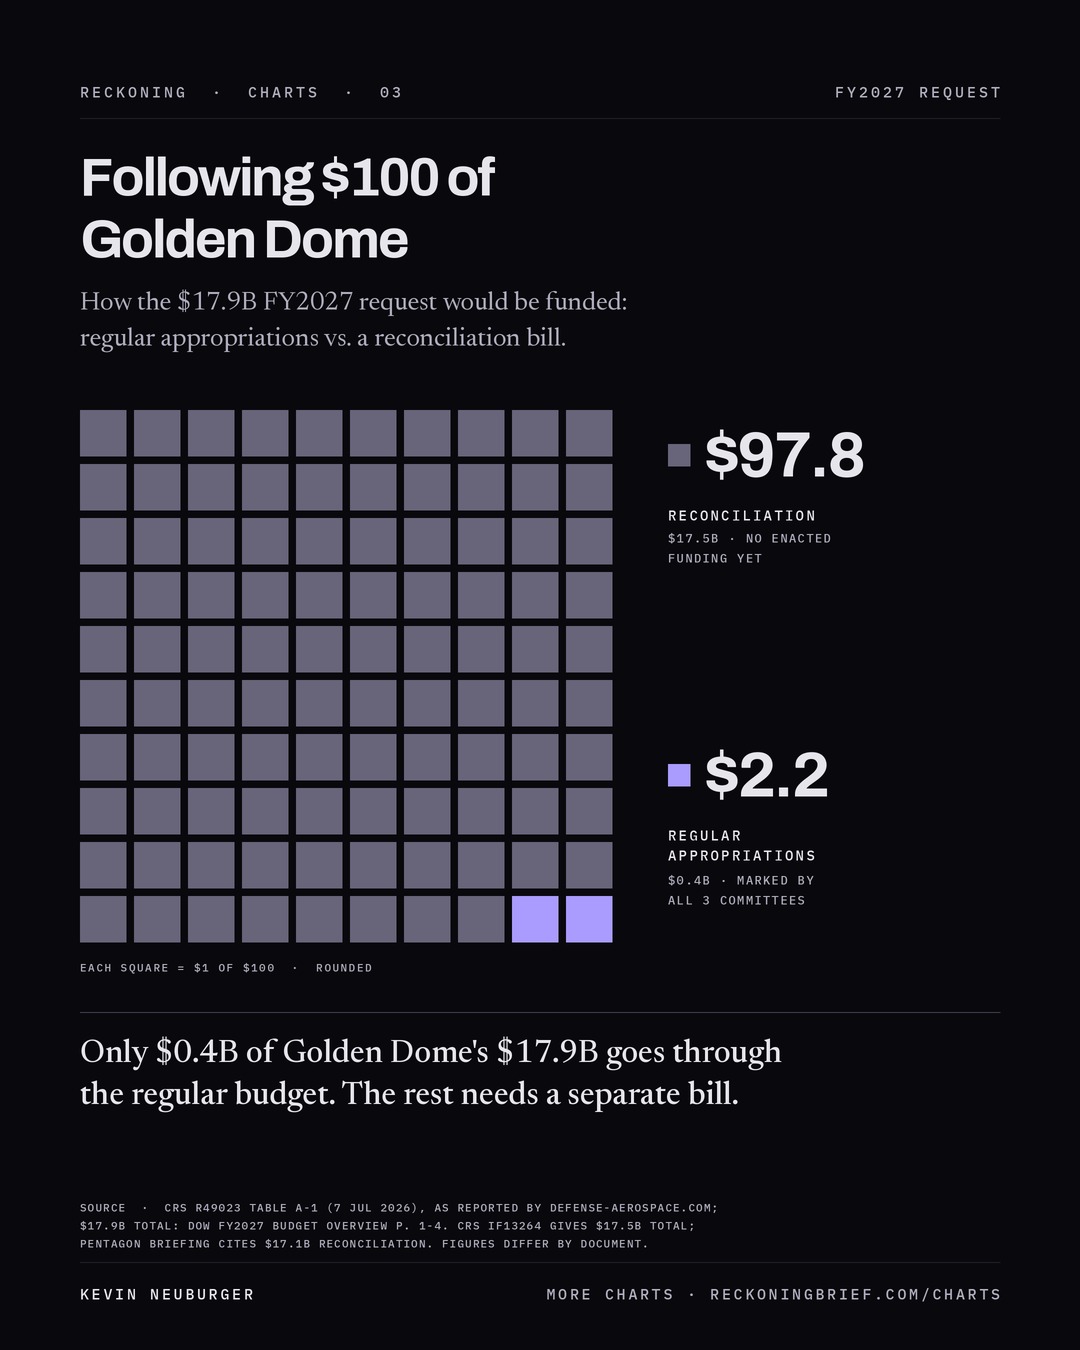
03 · Following $100 of Golden Dome
$97.80 of every $100 in the FY2027 request depends on a reconciliation bill.
8 Oct 2026
SourcesCRS R49023 Table A-1; DoW FY2027 budget overview p. 1-4.
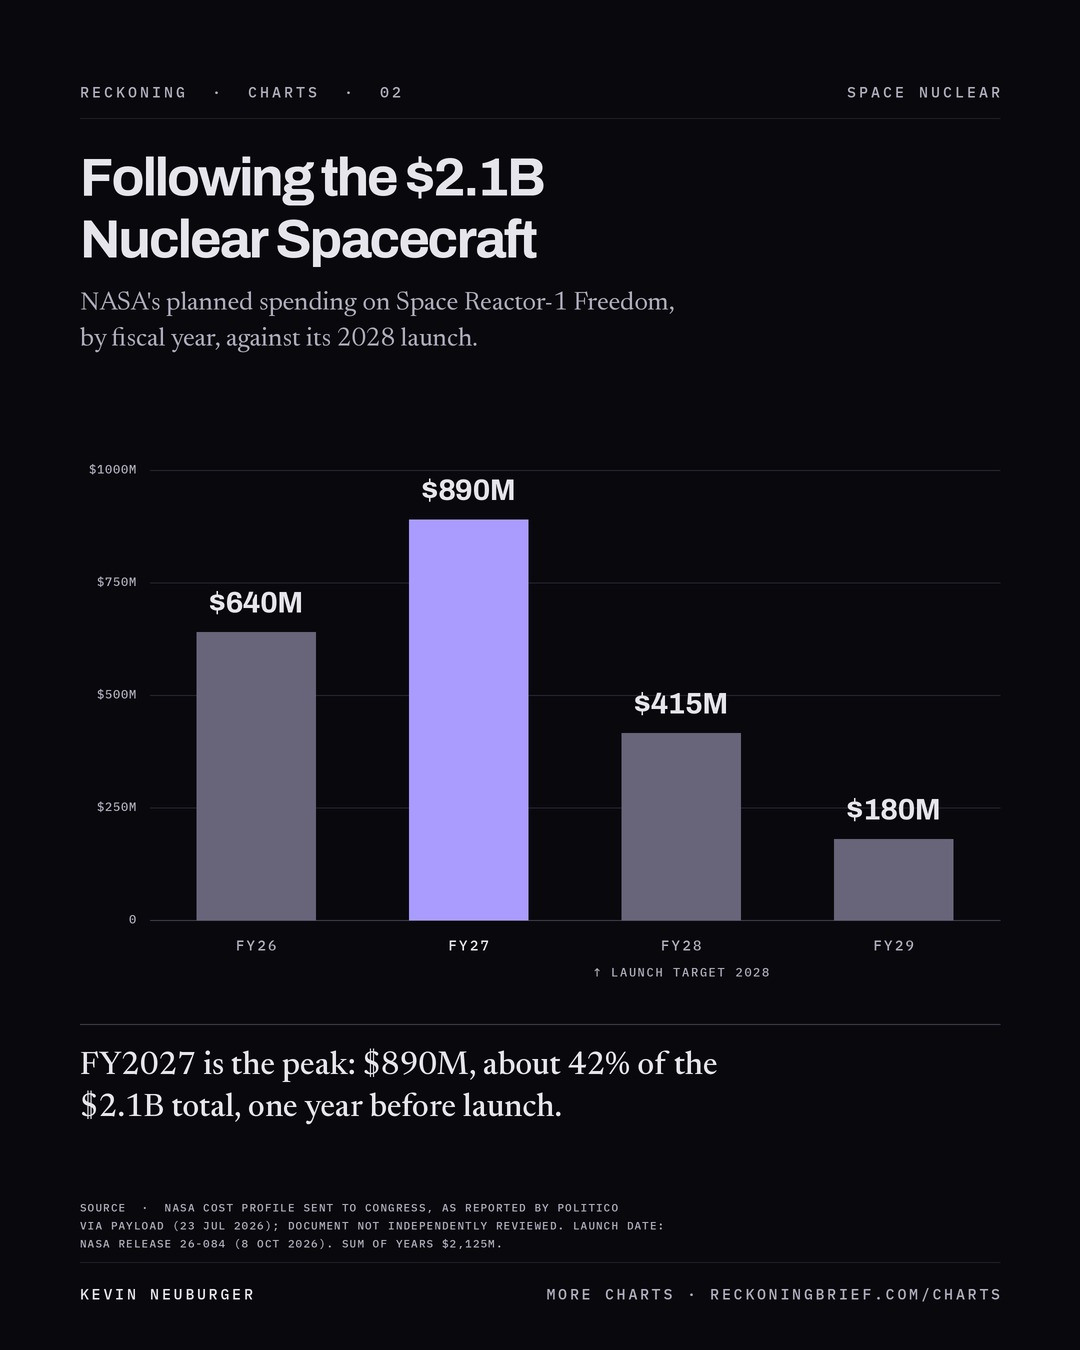
02 · Following the $2.1B Nuclear Spacecraft
NASA's planned SR-1 Freedom spending peaks at $890M in FY2027, a year before its 2028 launch.
8 Oct 2026
SourcesNASA cost profile as reported by POLITICO via Payload (23 Jul 2026); NASA release 26-084.
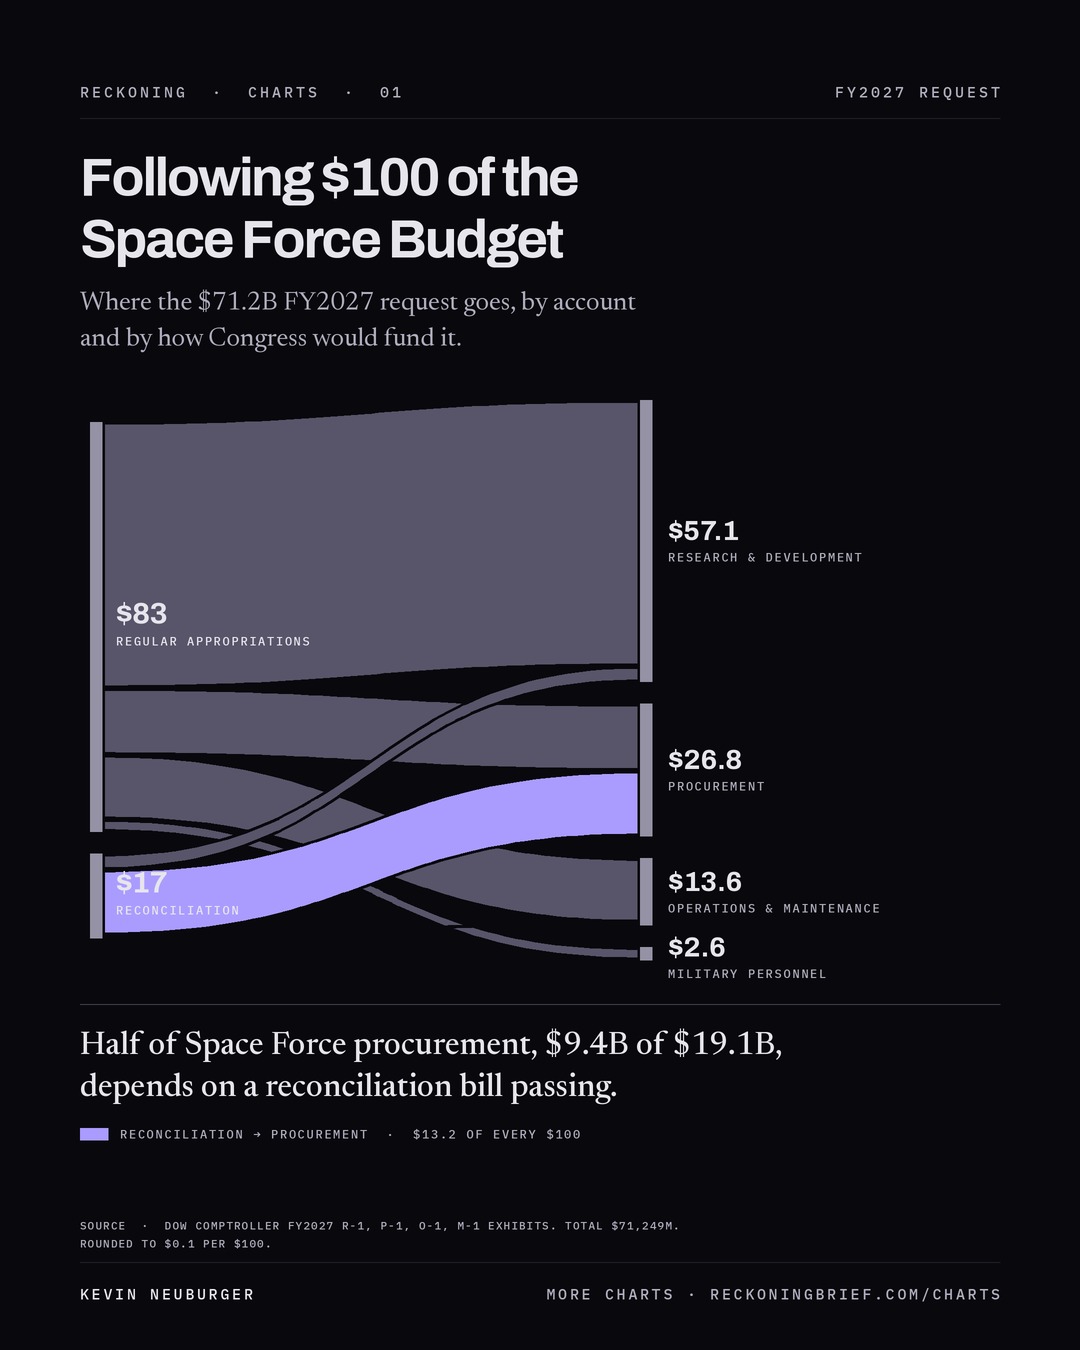
01 · Following $100 of the Space Force Budget
Half of Space Force procurement, $9.4B of $19.1B, depends on a reconciliation bill.
8 Oct 2026
SourcesDoW Comptroller FY2027 R-1, P-1, O-1 and M-1 exhibits.
Each issue in your inbox the morning it publishes, a note the day a forecast is graded, and occasional Reckoning news. Free, in English and Spanish. No list sharing, unsubscribe in one click. Privacy.