3 private positions, held through vehicles whose terms bar naming the company — recused
Commitment
sha256 fc5792fdae164aadbd7280cacf15d828808eb91fe2b593f426bcc1ec2025a593 · positions record version 2026-10-09
Intent, 90d none. I don't plan to buy or sell any company named in this issue before Jan 27, 2027.
How positions are declared, why some are not named, what a recusal means, and how the sealed record works: disclosure. Where a position I may not name sits in a company this issue would otherwise forecast, I publish no forecast on it and say so.
Reckoning covers space, defense, energy and manufacturing; this issue is the space economy.
Two cost curves run through this issue. Reusable launch, which W1 argued is captured by whoever owns the rocket. And AI-capex power: SpaceX's third-quarter 10-Q reports 1.7 GW of nameplate compute at 30 September, against 0.6 GW a year earlier, and in the same quarter its AI segment, now called SI, booked $7,560M of revenue to Starlink's $5,248M. At gross book value its balance sheet carries $43.2B of servers and networking equipment against $14.7B of satellites. One company, one balance sheet.
The call
2026-09-004 · Space
Starlink's segment tops $19B in 2026
18% · Monte CarloResolves 2027-04-30
Disclosure: I hold SpaceX.
Claim, falsifier, and reasoning
ClaimSpaceX reports Connectivity segment revenue of at least $19,000 million for the fiscal year ended 2026-12-31 in its Form 10-K.
FalsifierThe Form 10-K for the year ended 2026-12-31 filed by Space Exploration Technologies Corp. (CIK 0001181412) on SEC EDGAR reports Connectivity segment revenue below $19,000 million in its segment note.
Monte Carlo · inputsQ1–Q3 2026 Connectivity revenue $3,257M, $4,291M, $5,248M (10-Qs); Q3 consumer $3,121M and enterprise and government $2,127M (Q3 10-Q, Note 3); subscribers 12.0M and 13.6M at 30 June and 30 September, Q3 ARPU $69; judged: Q4 net adds 1.4–2.5M, ARPU $65–72, enterprise and government growth +12% (or +35% in a large-booking quarter, 25% likely), hardware residual two ways. Model: scripts/forecasts/2026-09-004_mc.py.
How I got 18%
ModelQ4 Connectivity revenue = consumer service (average subscribers × ARPU × 3) + consumer hardware residual + enterprise and government. P(YES) = share of 1,000,000 trials in which Q4 ≥ $6,204M, blended 50/50 over two hardware cases.
Q4 net adds, millions (triangular 1.4 / 1.9 / 2.5) = 1.90Starlink adds 1.4 to 2.5 million consumer subscribers in Q4, most likely 1.9 million.Evidence. Subscribers rose from 12.0M at 30 June to 13.6M at 30 September (Q2 and Q3 10-Qs). The range is a judgement.
ARPU, $ a month (triangular 65 / 68.5 / 72) = 68.50Consumer ARPU in Q4 is $65 to $72.Evidence. Q3 ARPU was $69, Q2 $66 (10-Qs). The range is a judgement.
Large enterprise and government booking quarter, probability = 0.25One chance in four that Q4 carries a large carrier or government booking (+35% ± 12% on Q3's $2,127M); otherwise +12% ± 8%.Evidence. Q3 enterprise and government was $2,127M (Q3 10-Q, Note 3). The probability is a judgement.
Hardware residual = 471.00Q3 consumer revenue less subscribers × ARPU leaves $471M of hardware and other; in Q4 it either grows with consumer or falls back after a Q3 retail sell-in, 50/50.Evidence. Inferred, not filed: $3,121M − 12.8M × $69 × 3.
CorrelationThe draws are independent. A single cause that lifts adds, ARPU and bookings at once (India going live, say) would widen the upper tail beyond what the model shows.
Through 30 September the segment has booked $12,796M, so the threshold asks one question: whether the fourth quarter reaches $6,204M, 18% above the third quarter's $5,248M, after sequential steps of 32% and 22%. All of 2025 was $11,387M. The answer arrives with SpaceX's Q4 earnings release early next year; the 10-K confirms it. For an investor, this decides whether the one profitable line in the investable space economy is still compounding at the rate the filings implied, or whether the steps are shrinking toward an ordinary growth rate, in the company that is more than half of everything you can buy. For a strategy team, it decides whether Starlink's enterprise and government line, up $1,016M year on year in the third quarter on aircraft activations, is the customer you plan around or a number to wait out.
Who this changes a decision for
Telecom — build or partner. A competing constellation is underwritten against list prices for launch and against an incumbent whose audited connectivity segment earned $4,423M of operating income on $11,387M of revenue in 2025, a 39% margin, while ARPU fell from $99 a month in 2023 to $66 by mid-2026. Until SpaceX publishes a Starship price per kilogram (W1's entry), assume cheap capacity is captive and build around distribution, spectrum and customer relationships rather than owned space assets. For Latin American operators the calculus is sharper: the alternative to partnering is not a domestic constellation but ceding rural broadband.
Insurance — price the asset, or the logistics. Satellite services are $105B of revenue on SIA's count, and the asset base behind Starlink carries a gross book value of $14.7B. When replacement plus launch costs less than a decade of premium, operators self-insure by flying spares, and the premium pool shrinks to launches and the large GEO assets that remain. Track replenishment cadence, not launch price: the moment an operator moves to scheduled block replacement, the in-orbit risk you are pricing has become a logistics contract. Rideshare cuts the other way for small operators: SpaceX's page still reads $7,000/kg for 2026, on a ladder that has risen every year since 2023.
Mining and earth observation — buy scenes, or buy cadence. The whole commercial remote-sensing services line is $3.6B, 0.8% of SIA's headline, and its largest listed name, Planet Labs, lost $247M on $308M of revenue in its last fiscal year. What launch cost buys here is revisit rate, and revisit rate is what turns imagery from a report into a control system. The decision it changes is whether to keep paying per scene or to contract for a monitoring service with a guaranteed cadence. Track price per revisit-hour, not price per image. In Latin America this lands hardest on copper and lithium operations in Chile, Peru and Argentina.
The argument
The headline market number is a definition, not a measurement. The cash sits in one segment, and most of what you can buy is one company.
Three pieces of evidence carry that, and the first is the one that makes the others legible: the compilers do not disagree about the size of the space economy; they disagree about what it is.
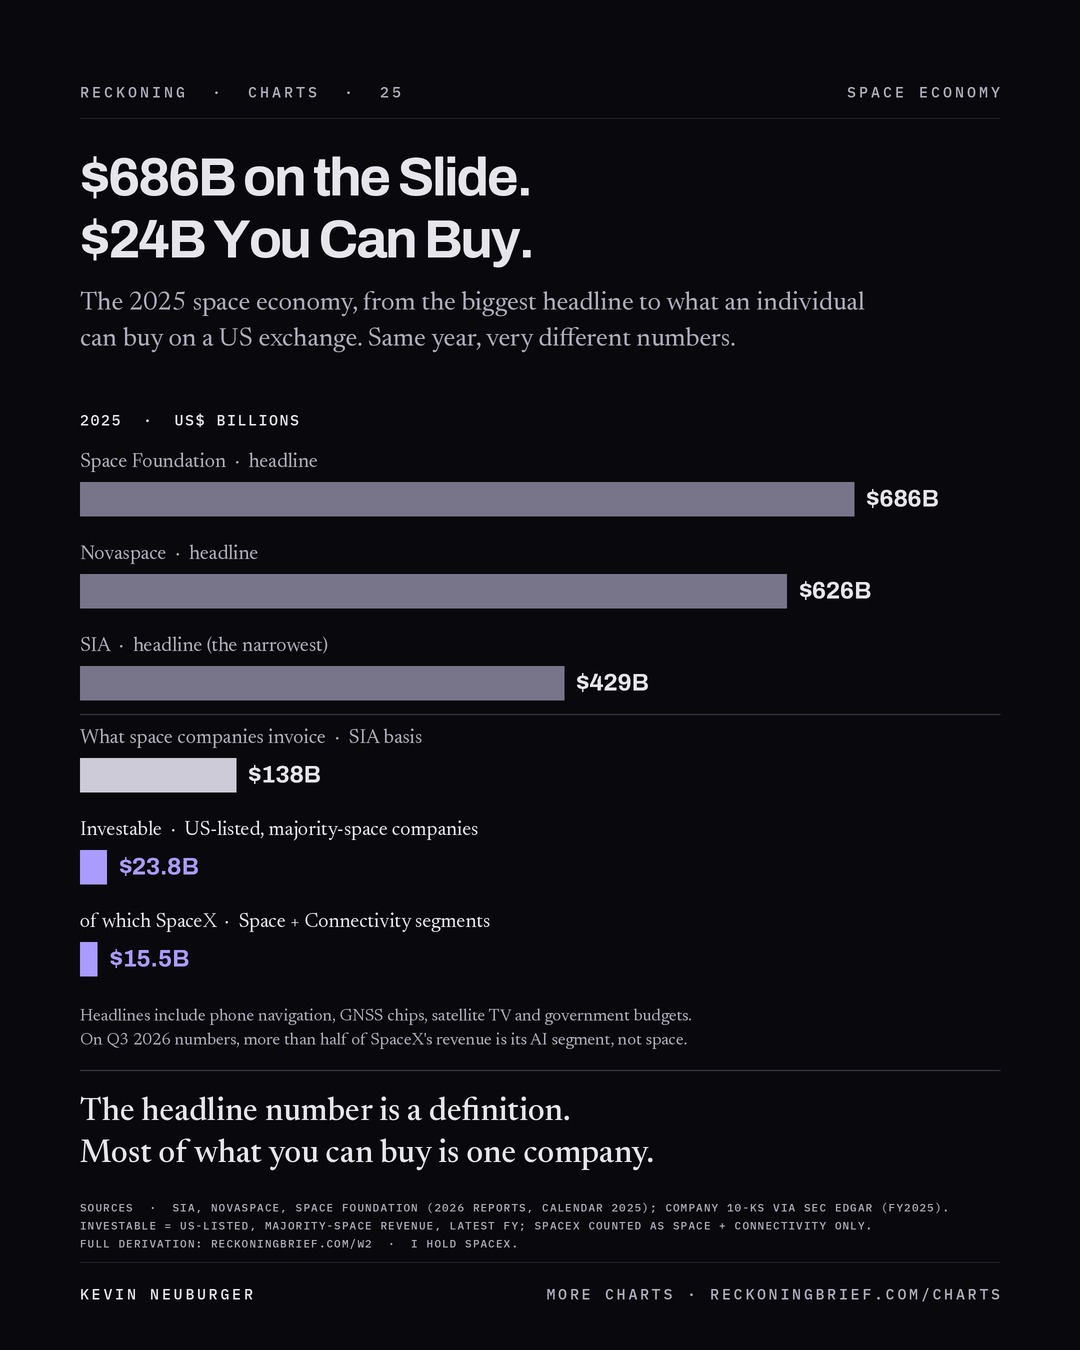
One. Three totals, one year, sixty percent apart. For calendar 2025 the Satellite Industry Association puts the global space economy at $429B, Novaspace at $626.4B, and Space Foundation at $686B. These are analyst estimates, all three, and they are not three measurements of one quantity. They are three definitions, and each publishes enough of its own composition to show where the $257B of daylight comes from.
Space Foundation's $686B is 79% commercial, $544.3B, and $385.9B of that commercial figure is what it calls satellite-enabled products and services: the things sold on Earth that rely on a satellite somewhere. Positioning, navigation and timing services are $279.9B on their own, 41% of the entire headline, and the report describes the largest part of that as smartphone navigation and mapping. Its ground-equipment line includes $103.6B of GNSS device sales, citing EUSPA, of which about 85% is consumer electronics.
Novaspace's $626.4B contains a figure it calls the space market, $236B, for activity directly tied to space infrastructure. The remaining $390B is space-enabled solutions, PNT among them. By Novaspace's own definition, 62% of its headline is not the space market.
SIA's $429B is the narrowest and the most itemised. $303B of it is the satellite industry, and inside that, $125.8B is GNSS equipment, $80.2B is consumer services (satellite television, satellite radio and end-user broadband) and $20.3B is consumer equipment such as dishes. That is $226B, three-quarters of the satellite industry, made of chipsets, dishes and subscriptions. Direct-to-home television alone is $66.4B and fell 8.2% in the year; satellite radio is $6.4B, all of it one company.
Then government. Space Foundation counts about $141B of government budgets for 2025, Novaspace $138B, and SIA's non-satellite remainder, government budgets plus commercial human spaceflight, is $125.7B. Budgets are appropriations, not revenue, and most of a NASA or Space Force budget becomes contractor revenue that a commercial line may already contain. None of the three public releases says whether that overlap is netted out. I do not add government to anything.
Strip the headline to what a space company actually invoices and SIA's basis gives $105.0B of satellite services, $20.4B of manufacturing, $12.4B of launch and $0.5B of sustainability services: $138B, and $80B of the services line is the consumer television, radio and broadband bucket. The operating space economy that is not a chipset, a dish or a budget is on the order of $140B. That is a third of SIA's headline and a fifth of Space Foundation's.
Two. Where the cash is, audited. The table uses SIA's segments because SIA is the compiler that itemises. The profitability column uses filed accounts, latest fiscal year.
Starlink operating income $4,423M; Iridium net $114M; Planet net −$247M
M5, F1, F9, F10
Satellite manufacturing
$20.4B
4.8%
Karman net $17M; Redwire net −$227M
M4, F11, F12
Launch
$12.4B
2.9%
SpaceX Space segment operating loss −$657M; Rocket Lab net loss −$198M; Firefly net loss −$298M
M4, F1, F6, F13
Space sustainability
$0.5B
0.1%
—
M5
Investable slice (boundaries in the text)
$23.8–28.3B
5.5–6.6% of SIA; 3.5–4.1% of Space Foundation
SpaceX is 55–65% of it
F1–F21, S1–S3
Read the column on the right. In 2025 SpaceX's Connectivity segment earned $4,423M of operating income on $11,387M of revenue, and in Q3 2026 it earned $2,367M on $5,248M. Its Space segment, which is the launch business as sold to outside customers, lost $657M on $4,086M across 170 launches; the filing is explicit that Starlink's own launches are not recognised as revenue there, so the segment is not the whole launch operation, but it is the whole launch market SpaceX sells into. In Q3 2026 it came within $7M of break-even, on $1,767M. Rocket Lab lost $198M on $602M. Firefly lost $298M on $160M. Launch is the segment everybody names and the one in which no filer has yet shown a profit.
Earth observation is the same shape smaller: the entire remote-sensing services line is $3.6B, and Planet lost $247M on $308M. Mobile satellite services is the exception among the listed names, Iridium earning $114M on $872M. Manufacturing splits: Karman earned $17M on $472M; Redwire lost $227M on $335M. And the largest single cash commitment in the sector is not for hardware at all: SpaceX's $19.6B for 65 MHz of EchoStar spectrum, licences moved into a trust in May 2026 with final closing expected in November 2027, against $14.7B of gross book value for the satellites on its balance sheet at 30 September 2026.
So the cash in the operating space economy is in connectivity, and within connectivity it is in one segment of one company. Everything else in the table is either not a space company's revenue, or a space company's loss.
Three. The investable slice. The number this issue exists to publish, with its boundaries written down so it can be restated rather than defended. Investable means: shares an individual can buy on a public exchange, in a company whose revenue is majority space, at the latest reported fiscal year. For SpaceX I count the Space and Connectivity segments and exclude the AI segment. US SEC filers first, then the two European operators at the ECB reference rate of 11 September 2026, 1.1592 dollars per euro.
Against the three headlines, that is 5.5–6.6% of SIA's, 3.8–4.5% of Novaspace's and 3.5–4.1% of Space Foundation's. A low single-digit share of the number on the slide, and more than half of it one company.
One caveat on the largest name: buy SpaceX today and, on Q3 2026 numbers, more than half the revenue you own is its AI segment, not space.
Three concessions keep this honest. A reader who wants GNSS exposure can buy Qualcomm; the chipset revenue is real, it is just not a space asset. Excluded and named: EchoStar, whose revenue is majority pay television; Maxar, private since 2023 and gone from the public record; MDA, Telesat and Astroscale, which file outside the SEC and are not in the sum; and the space divisions of the large defense primes, which are not separable as a share. Each exclusion moves the slice, and none of them moves it out of single digits. And of the $8.3B of listed revenue outside SpaceX, the lander, station, manufacturing and imagery names are majority government-funded. That is a real position in a real company. It is not a market, and later issues will lean on the distinction.
Which is why the call above is what it is. If the investable space economy is $24–28B and one segment of one company is the profitable core of it, then the one forecast worth logging this issue is whether that segment is still compounding at the end of the year. $19,000M requires a fourth quarter of $6,204M, 18% above the third, after steps of 32% and 22%. The arithmetic is in the register entry, and the model is public: 2026-09-004_mc.py.
Definitions
Price versus cost (from W1). A launch price is what a customer is invoiced; a launch cost is what the operator spends. They are different numbers and the gap is a policy, not an accounting detail: Rocket Lab's audited FY2025 figures show $8.5M of revenue per Electron launch against $4.8M of cost. Published dollars-per-kilogram figures are prices divided by maximum capacity, which almost no mission fills. Every figure in this brief is labelled list price, marginal cost, internal cost or target. W1 — The Contract, and the Master Variable.
What would change my mind
Nothing audited arrives before the 10-K, so the cheap checks are the ones SpaceX publishes itself. Q4 needs about $956M more than Q3. Consumer adds at the third quarter's pace, 1.6 million, at Q3's $69 ARPU would add roughly $0.3B; the rest has to come from enterprise and government, where the Q3 increase came from aircraft activations, and from kit sales. Two things would move me up: a large carrier or government agreement booked in the fourth quarter, and India going live before December. Starlink holds its Indian licence, but as of 17 October commercial service had not started and security assessments were still under way. A year-end consumer count Starlink states above 15.5 million would add to either. A count near 14.5 million, or ARPU slipping back toward $66 as cheaper international plans dominate the adds, would move me down. On the wider argument, the thing that would damage it is a compiler publishing a total that separates purchasable space-company revenue from enabled downstream revenue as its headline. Novaspace's $236B space market is the closest anyone has come.
Close
A Spanish edition ships with every issue — Edición 02, same numbers, same table, same register entry.
The register is public and append-only — every claim above stays in it with its original wording and date, and is graded on the day it resolves whether or not that goes well: reckoning-register.
Next issue in two weeks: W3 — Delivered, Committed, Announced.
Sources
Every figure above traces to a line in the sources for this issue, with publisher and access date. The three headline totals are listed separately and are stated as three definitions rather than averaged. Company figures come from filed accounts on SEC EDGAR, read through the Commission's own XBRL company-facts feed, with the filing accession recorded on each line.
One limitation stated here rather than only in the appendix: SIA's segment sub-splits come from its one-page executive summary, an image, read visually; the full report is paid and was not purchased. Space Foundation's 2025 direct-to-home figure is itself a citation of SIA, so those two compilers are not independent on that line.
Each issue in your inbox the morning it publishes, a note the day a forecast is graded, and occasional Reckoning news. Free, in English and Spanish. No list sharing, unsubscribe in one click. Privacy.